gvSIG bugs #2827

Visualization issue with Mercator CRSs
| Status: | New | % Done: | 0% | |
|---|---|---|---|---|
| Priority: | Normal | Spent time: | - | |
| Assignee: | - | |||
| Category: | CRS | |||
| Target version: | - | |||
| Severity: | Major | Add-on version: | ||
| gvSIG version: | 2.1.0 | Add-on build: | ||
| gvSIG build: | 2247 | Add-on resolve version: | ||
| Operative System: | Add-on resolve build: | |||
| Keywords: | 3395, 3857, Mercator | Proyecto: | ||
| Has patch: | Hito: | |||
| Add-on name: | Unknown |
Description
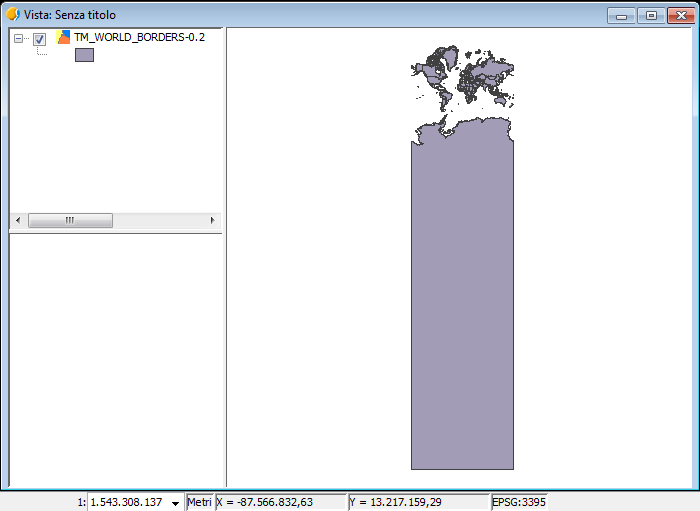
As described in #2747#note-5, there's a visualization issue of this shp [1] (EPSG:4326) in a view defined in EPSG:3395 (WGS84/World Mercator) or EPSG:3857 (WGS84/Pseudo-Mercator). See for instance [2].
[1] http://www.mappinghacks.com/data/TM_WORLD_BORDERS-0.2.zip
[2] https://redmine.gvsig.net/redmine/attachments/download/1010/EPSG3395.PNG
3857.png (38.9 KB)

History
#1
 Updated by Álvaro Anguix over 11 years ago
- Category set to CRS
#2
Updated by Álvaro Anguix over 10 years ago
Ahora, con los cambios en CRS, hay una aproximación mejor a este de incongruencias. La capa en cuestión tiene un punto de fuga, pero en general la visualización es correcta.
#3
 Updated by Antonio Falciano about 10 years ago
Álvaro Anguix wrote:
Ahora, con los cambios en CRS, hay una aproximación mejor a este de incongruencias. La capa en cuestión tiene un punto de fuga, pero en general la visualización es correcta.
The visualization was right before according to the Mercator projection theory, because it " [...] distorts the size of objects as the latitude increases from the Equator to the poles, where the scale becomes infinite" (From Wikipedia). The issue that I haven't well described in this ticket is the way the visualization is managed. Because the linear distortions tends to infinity moving towards the poles, the shapes should be clipped in memory in order to limit their extent before their visualization, for instance using the "World" (EPSG:3391) area of use defined between 80°S and 84°N. In fact, using the "Clip by rectangle" geoprocess on the shape, thus limiting the N-S extent, then the visualization reaches the best compromise both in EPSG:3395 and EPSG:3857. Definitively this is not a code bug, but only a known defect (that affects also other GIS applications). I'd leave this ticket open just for future reference.
#4
Updated by Antonio Falciano about 10 years ago
- File 3857.png added
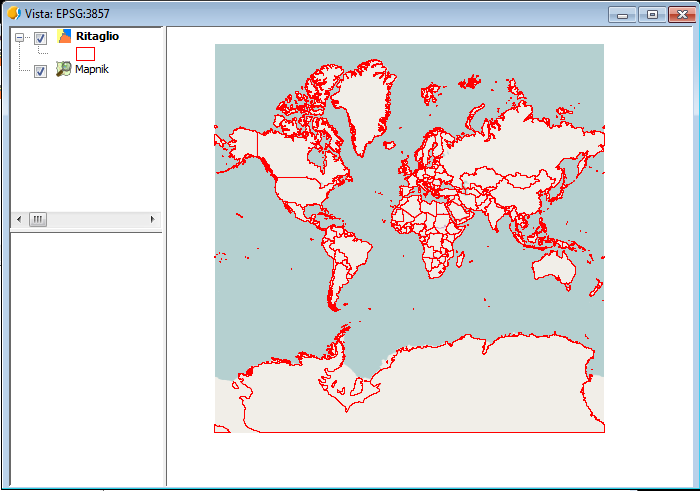
More precisely, the best compromise in visualization consists into limiting the N-S extent between -85° and 85°. See the screenshot in attachment where the clipped shape is compared with the Mapnik OSM layer in EPSG:3857.